
01 / ANALYSE
Read the chart your way.
Switch timeframes, mark levels and add the indicators that help you understand the market.
A WORKSPACE FOR SYNTHETIC INDICES
Charts, Replay and simulation in one workspace for analysing Boom, Crash and Volatility.
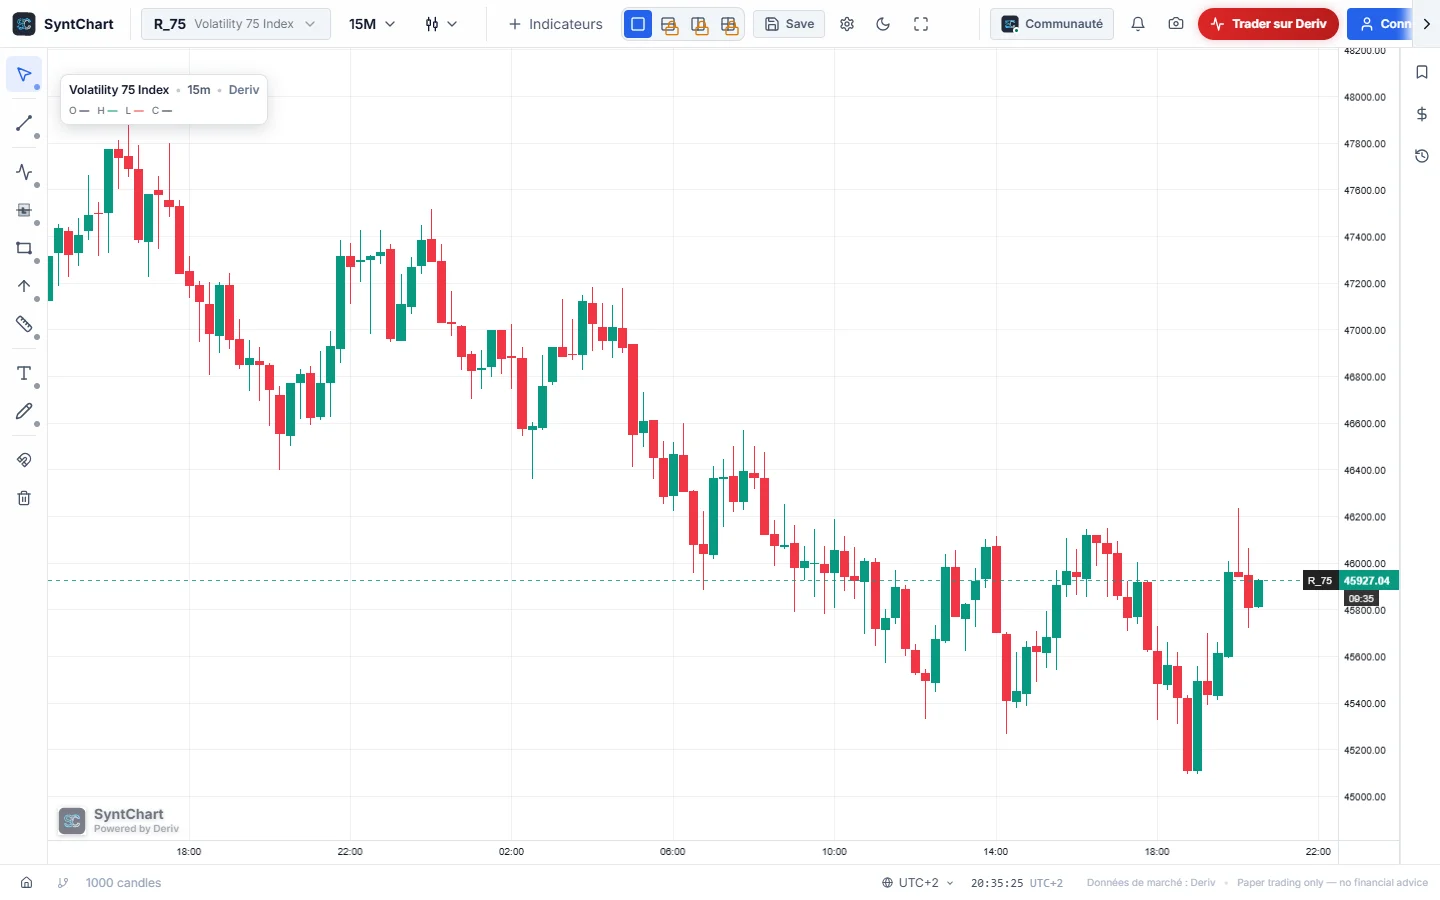
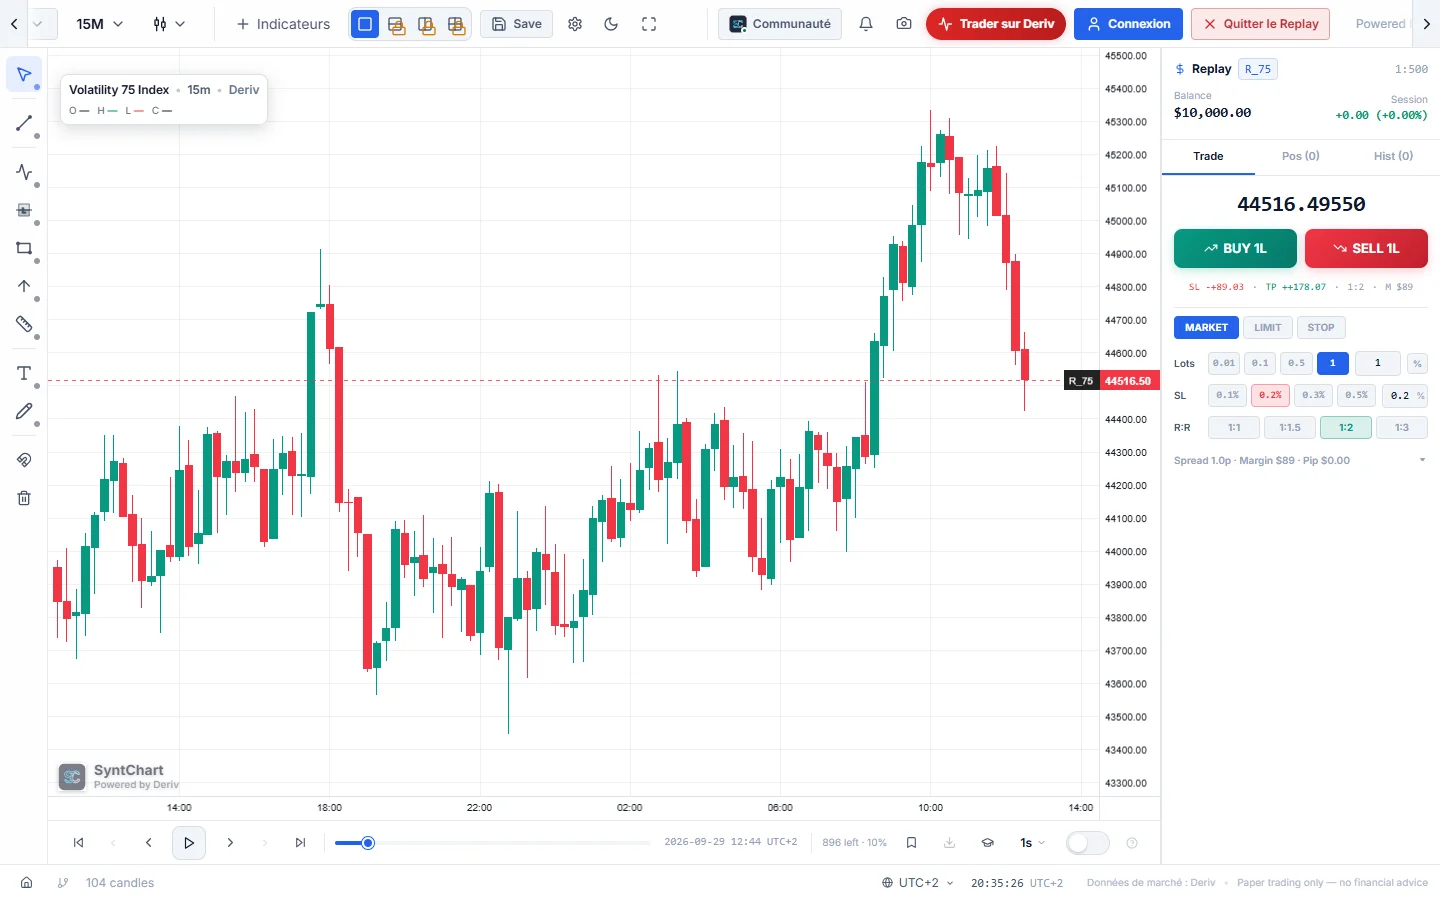
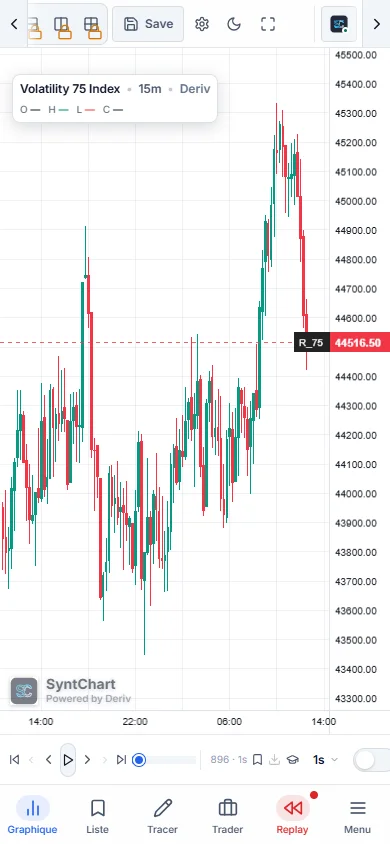
SyntChart · product interface · market data shown for illustration
Product
From your first observation to reviewing decisions, keep your tools in one place.
01 / ANALYSE
Switch timeframes, mark levels and add the indicators that help you understand the market.
02 / REPLAY
Choose a starting point and move through historical data to practise decisions, one candle at a time.
03 / SIMULATE
Use paper trading to observe simulated trades and compare your decisions with your rules.
REPLAY
Replay helps you examine a past sequence without waiting for the market to repeat it.
Select an instrument, an available date and a timeframe.
Observe the candles and switch scales to understand the context.
Record entries, invalidations and deviations from your plan.
WEB / MOBILE
View charts and access your tools in your browser. On smaller screens, navigation connects charts, drawing tools, trading and Replay.
SYNTCHART
Open SyntChart to explore the workspace. Some features require sign-in. Instruments and historical depth depend on the available data.
Open chartsGuides
Practical guides to learn the tools and structure your sessions.
Choose an instrument, read the axes and organise a clear chart.
Replay · 6 min readChoose a sequence and practise without reading ahead.
Simulation · 5 min readKeep execution assumptions separate from simulated results.
SyntChart is a workspace for analysing synthetic indices, with charts, Replay and simulation.
No. Paper trades are simulated and do not reproduce every execution condition of a live account.
Availability varies by instrument, timeframe and supplied data. Check the accessible period inside the product.
The workspace opens in your browser, on desktop and mobile.